The DRY SEASON in West Africa (November to April)
Biomass burning
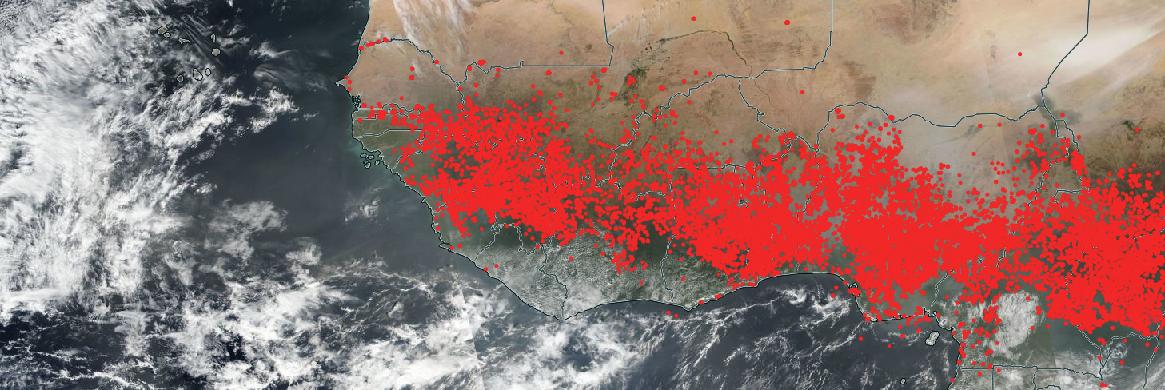
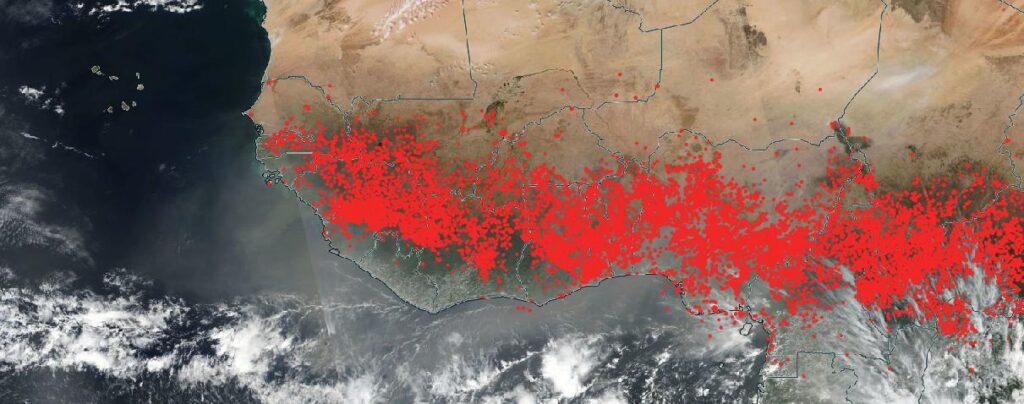
Each year after the rains which provide farmers the necessary water to grow crops end, they begin burning their fields. There are multiple reasons, for example, to remove the waste products from the field or to put nutrients in the form of carbon back into the soils. However, the burning of fields also leads to poor air quality with small black carbon aerosols, carbon monoxide, NO2, and Ozone making for unhealthy air for anyone. The burning occurs over a very large region with smoke traveling for thousands of miles from east to West (Figure 1).
Saharan Dust Storms
This is also the time of year, when the Sahara Desert is active. When strong winds occur, the desert dust is lifted and driven into populated areas. (Figure 2). While you might think that desert dust is less dangerous than smoke, the current thinking is that desert dust kills more people in Africa than any other source. We think that leads to strokes, heart attacks and drives respiratory disease like Bronchitis, Pneumonia and Asthma leading to emergency room visits..
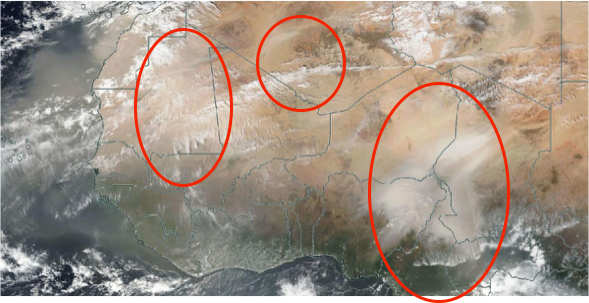
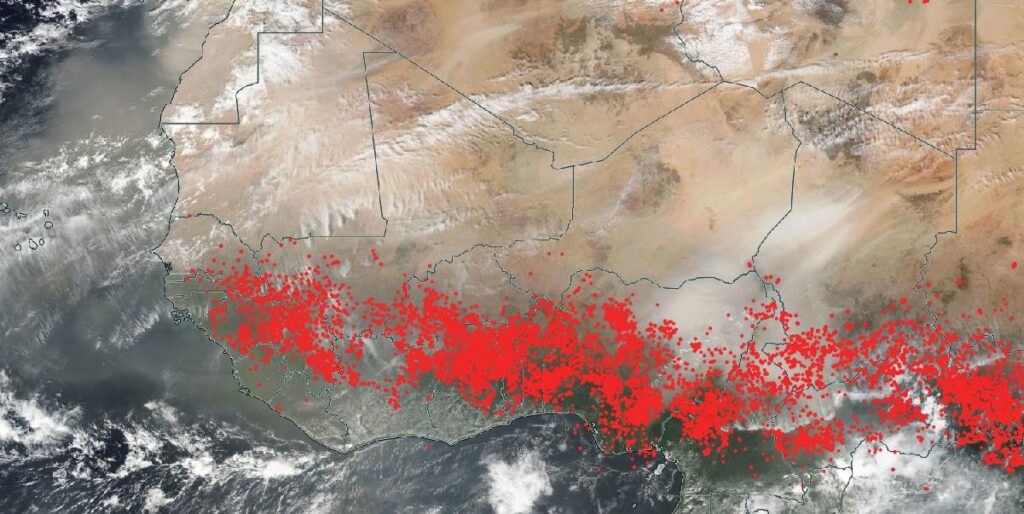
It is when the fires are combined with dust events and local pollution that we have very bad air quality event. So the big dust event in Figure 3 does not take into account pollution from the large megacities like Dakar, Accra or Lagos – which in sum might have 30 million people. The smallest of the dust or black carbon particles from fires or cars known as PM2.5 is what we worry about, because it can go deep into the lungs.
COVID-19 and Poor Air Quality
In my last blog, we find that COVID-19 remained relatively low in West Africa but the second wave has arrived during dry season when the pollution levels are high. The current level of knowledge suggests that air pollution is linked to COVID-19. In high particulate matter (PM) regions, COVID-19 seriousness and mortality are greater and contains the dimension of environmental justice in communities of color in the United States. Results also show that COVID-19 transmission (R0) is higher in polluted areas where high long-term exposure of PM2.5 (composed sulfate, ammonium, and black carbon) aerosols exceeds healthy standards.
The primary challenge of linking the environment to disease in Africa is access to health and environmental data. The World Health Organization (WHO) makes daily COVID-19 data available even with limited testing in African countries but it is difficult to local data.
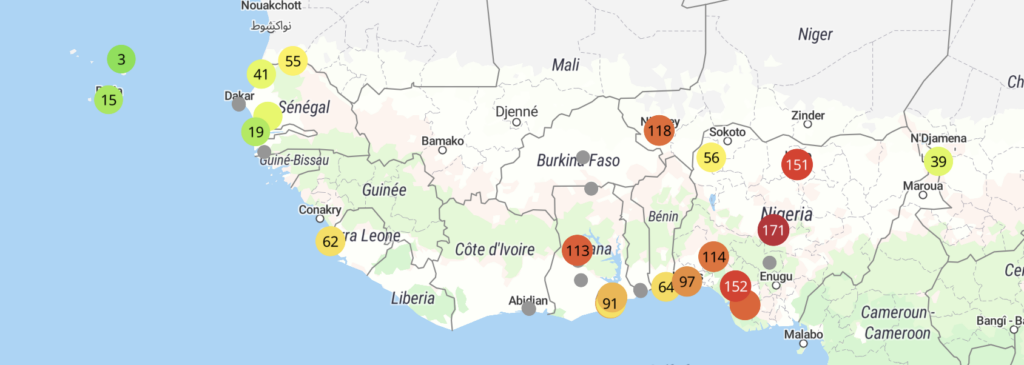
Air quality data is extremely sparse in Africa. Still, the use of low-cost sensors enables the monitoring particulate matter concentrations. Over the last year, we have deployed low-cost purple air sensors in Senegal, Cabo Verde, Nigeria, Ivory Coast, and Angola through international partnerships with my center AESEDA (Figure 4). These data can be used with daily COVID-19 data, satellite-based fire data , to examine air-pollution- COVID-19 relationships.
Brief Analysis from 2020 in Angola, Nigeria and Senegal
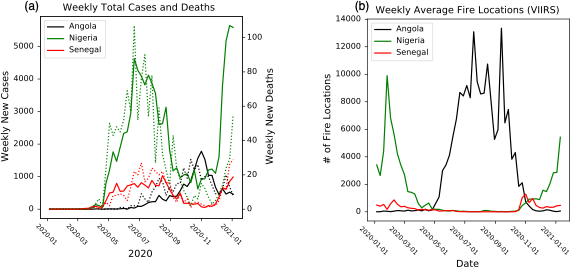
Figure 5a shows the weekly COVID-19 cases and mortality for Nigeria, Senegal, and Angola. The first wave of COVID-19 new cases and deaths in Nigeria and Senegal occurred during the late NH spring and through the summer of 2020, while it was slightly delayed in Angola beginning in August and reaching its maximum values at the end of October. Biomass burning, which is a significant source of regional pollution and identified through thermal anomalies, occurs during the dry season, reaching the largest number of locations in Nigeria and Senegal during February (Figure 5b). In contrast, the biomass burning season begins in May, with the maximum number of fire locations found in August and November in Angola. Senegal and Nigeria also received dust intrusions during the January through March 2020 which we could have shown through Satellite Aerosol Optical depth but did not.
Nigeria case study during November and December 2020
Nigeria has the largest population on the continent in Africa with more than 200 million people. It the largest economy in West Africa and one of the top oil exporters in the world but the wealth is not evenly distributed. Air pollution is a problem in Nigeria because of the large cities, industrial pollution which includes the oil industry, the large number of cars, biomass burning and dust incursions from the Desert. We have been fortunate to have partnership with the Center for Atmospheric Research which is led by my colleague Prof. Babatunde Rabiu. He has put up 10 stations across Nigeria, providing real-time data to the population. Thank God, the stations were in place for the dry season pollution.
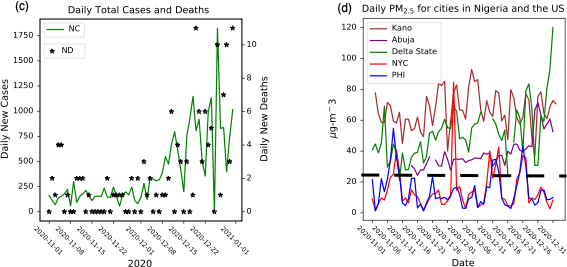
Figure 6c shows that daily reported COVID-19 new cases and deaths in Nigeria between 1 November and 31 December 2020 show a significant rise in new cases after 1 December 2020, reaching more than 1700 new cases in late December, although there is variability in the daily reports; the number of new deaths also increases during the month of December.
At the same time, figure 6d shows unhealthy daily PM2.5 concentrations at locations across Nigeria in Kano (north), Abuja (central), and Delta State (south) during December. For reference we put in daily values for Philadelphia PA and New York city.
The values in these three cities increased throughout the month while COVID-19 cases were increasing. For reference, daily PM2.5 concentrations from New York City and Philadelphia show smaller concentrations during the period, although values at the selected site in NYC exceeded 80 mg-m-3 on one day. November and December average monthly PM2.5 concentrations are 2-4 times smaller in NYC and Philadelphia when compared to Nigeria cities.
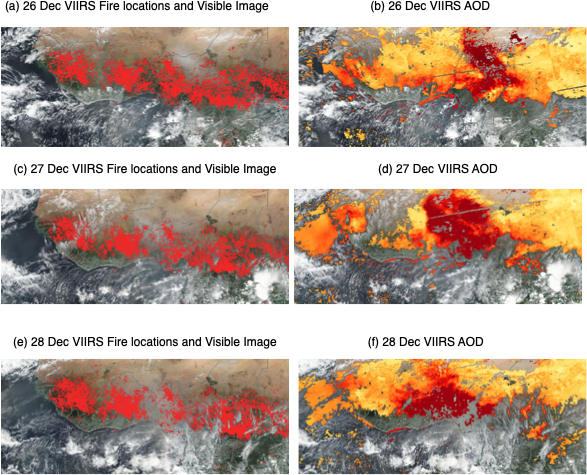
During the last week of December, a large Bodele depression dust event transported large amounts of dust into Nigeria in as high pressure moved into Libya (Figure 7). Simultaneously, the number of fires within the country and smoke transported from the east continued to increase biomass burning aerosols. Together, very high PM2.5 concentrations were found throughout Nigeria.
A light at the end of the tunnel or more hard days ahead?
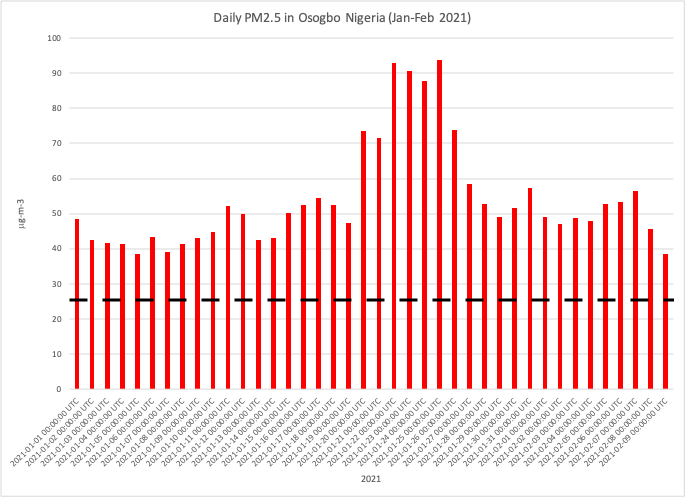
I would love to say that I see an end in sight to the poor air quality but I cannot. We have learned this year, that when dust moves down to the coast of Nigeria and other Guinea countries, it is remains stuck much longer any model suggest. Take Osogbo Nigeria which is located in the South Central part of Nigeria (Figure 8). This year there has not been one day when the PM2.5 concentrations have been less than the WHO guidance of 25 mg-m-3.
Given that the PM2.5 is likely to make COVID-19 more serious if you contract it, people have to do their best to mask up and not have too much exposure to people or pollution. I am sorry, if this blog was technical but sometimes y0u must use whatever you have at your disposal to identify threats to the population while assisting in understanding.
Be Cool